Chapter 1.6 follows chapter 1.5, Measurement of one cell, and precedes chapter 1.7, Findings of the shakedown batches, within part 1, the reading path.
The statistical analysis plan (SAP) is the dated record that fixes the estimands, comparisons, outcomes, tests, and decision rules before confirmatory data are collected. The current plan is version v005, re-registered on 2026-08-11.
source: 6. Metrics/statistical_analysis_plan.md line 26
The plan fixes the population, treatment contrasts, outcomes, summaries, repetition counts, correction rules, and outcomes that count against the treatment.
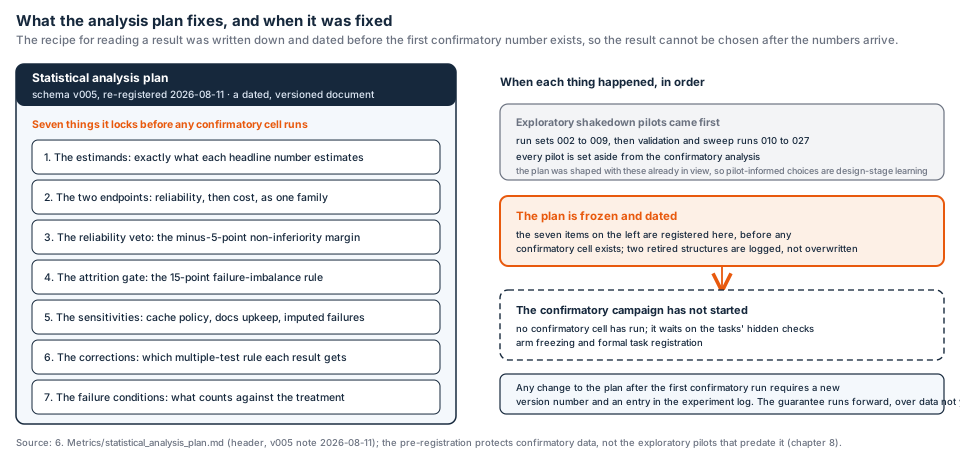
The registered plan fixes the analysis rules before confirmatory data are collected.
1.6.1 Estimands and comparisons of the documentation experiment
An estimand is the precise quantity an analysis is designed to estimate. The primary comparison is the documented build against the rebuilt control. The secondary comparisons are the documented build against the stripped twin and the stripped twin against the control. Together, these are the three registered comparisons. The retired composite baseline is not a registered comparison.
The reliability estimand measures the paired difference in the proportion of eligible cells that achieve success within budget. The cost estimand measures the paired difference in tokens to success among pairs in which both arms succeed. Tokens to success means input, output, and cache-creation tokens, with cache reads excluded from the headline measure.
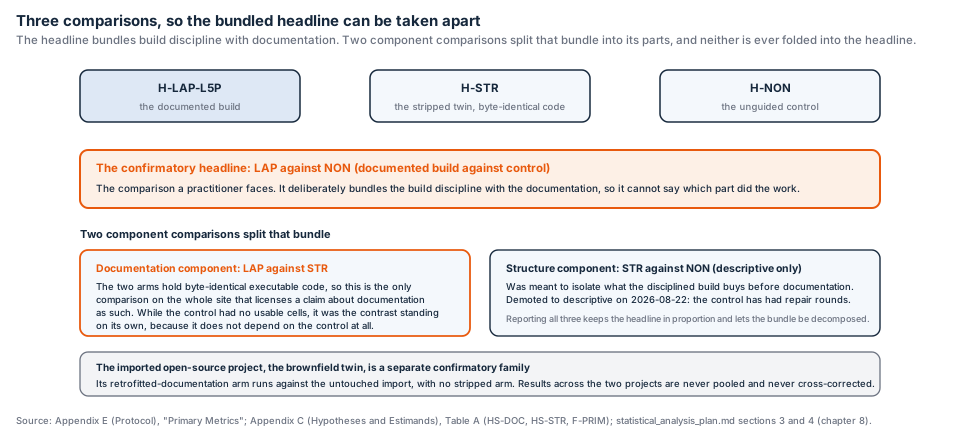
The estimand decomposition fixes the population, contrast, outcome, and summary measure.
A matched pair is two cells with the same task and seed and different arms. A pocket is a registered subset of tasks with a stated task profile. The primary pocket is the medium-vagueness, invariant-dense task subset.
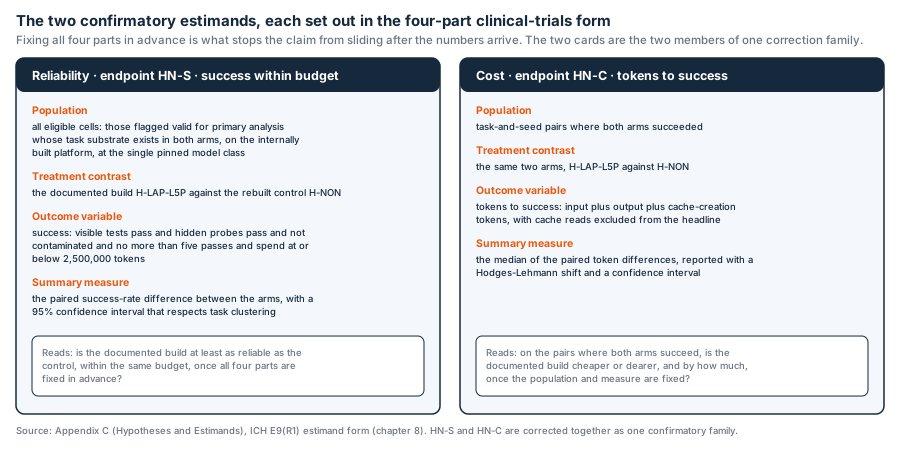
The estimand anatomy connects each registered quantity to its population and summary.
1.6.2 Repetition counts and power
The repetition count, k, is the number of seeds per cell. A pilot uses k of 3 seeds per cell.
source: 6. Metrics/statistical_analysis_plan.md lines 110 to 114
A confirmatory cell has a minimum of 10 seeds, and the primary pocket uses 20 seeds.
source: 6. Metrics/statistical_analysis_plan.md lines 110 to 114
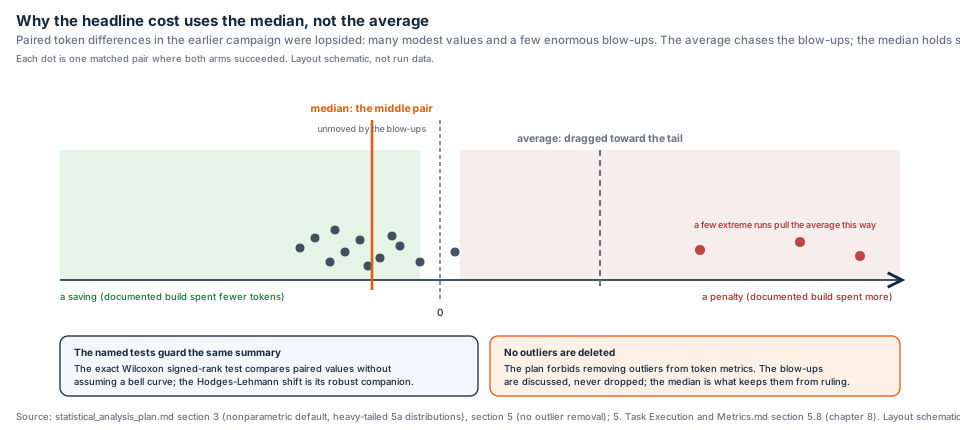
The paired median keeps the summary tied to the registered estimand when observations have a heavy tail.
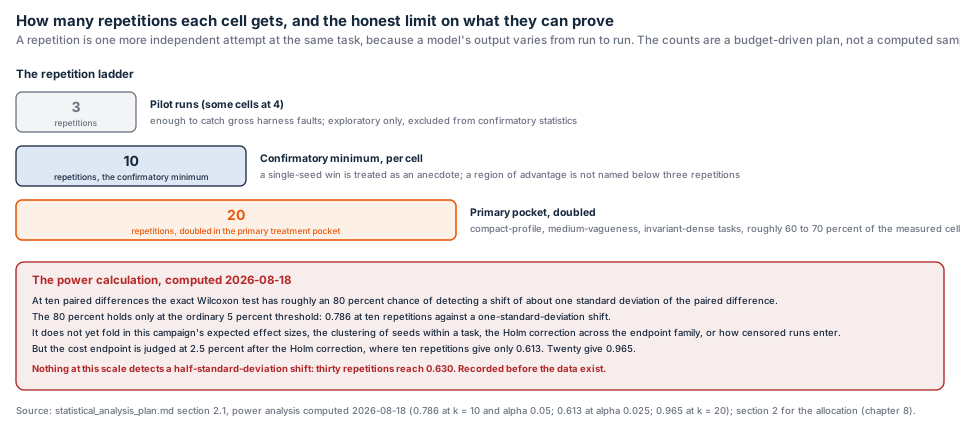
The repetition and power figure shows the simulated support for the registered counts.
The power calculation uses ten pairs and simulation of twenty thousand studies per setting. Power is 0.786 against a shift of one standard deviation and 0.613 at the stricter level. The computation date is 2026-08-18.
source: 6. Metrics/statistical_analysis_plan.md lines 123 to 177
1.6.3 Corrections and failure margins
A Wilcoxon signed-rank test is a paired test that ranks the absolute differences and uses their signs. The Hodges-Lehmann shift is the median of the Walsh averages and summarizes the paired shift. Cliff’s delta is the probability of one direction of paired difference minus the probability of the reverse direction.
A Holm correction orders a family of test results and adjusts their thresholds to control the family error rate. A Benjamini-Hochberg correction orders results and controls the expected share of false discoveries in an exploratory family. Holm applies within the two-endpoint confirmatory family. Benjamini-Hochberg applies to exploratory families.
source: Appendix B, Normative Reference.md section (d) line 124
A non-inferiority margin is the prespecified limit for how far an outcome may fall below the comparator while retaining a non-inferiority claim. The margin is minus five percentage points and acts as a veto on the reliability endpoint.
source: 6. Metrics/statistical_analysis_plan.md line 213
The attrition-imbalance threshold is fifteen percentage points. Beyond that threshold, the cost endpoint is descriptive only.
source: Appendix B, Normative Reference.md section (d) line 122
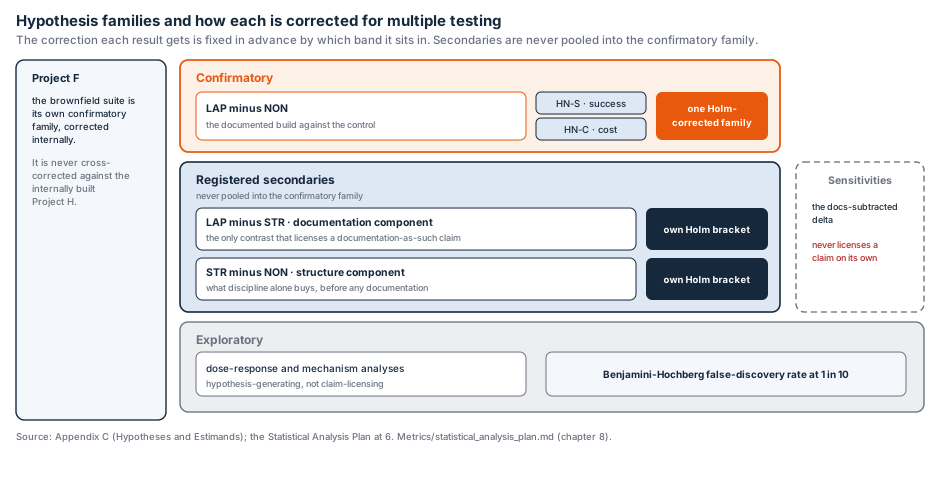
The correction map separates the confirmatory family from exploratory families.
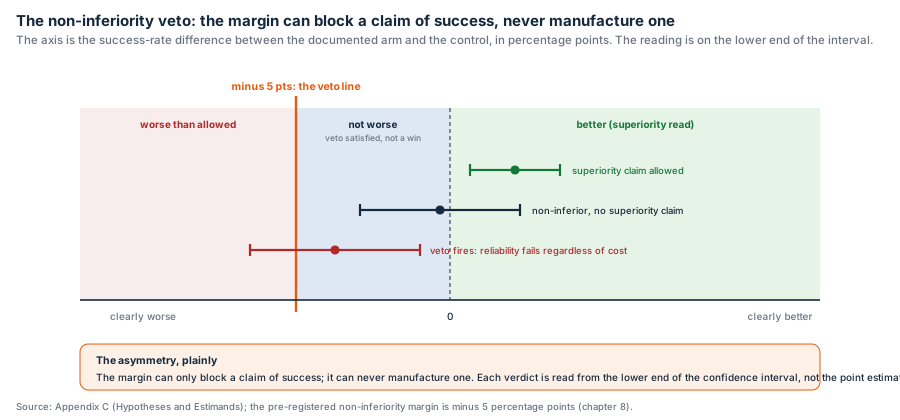
The non-inferiority margin is a veto for the reliability endpoint.
1.6.4 Boundaries and primary inclusion
A boundary is a prespecified point after which cells may not be pooled. A collider is a variable caused by both sides of a causal path, so conditioning on it can create a misleading association. The causal diagram separates treatment, success, cost, attrition, and the selection paths that can create collider bias.
Figure fig-extra-causal-diagram. A causal diagram shows treatment affecting success and cost, attrition affecting observed cost, and conditioning on a shared consequence opening a collider path.
%% figure fig-extra-causal-diagram
flowchart LR
  n1["A causal diagram shows treatment affecting success and cost<br/>attrition affecting observed cost<br/>conditioning on a shared consequence opening a collider path"]
source: operations/site-ia/A3-diagram-specification.md
The causal diagram identifies treatment paths, attrition paths, and collider paths.
For the primary analysis, inclusion is the conjunction of valid_for_primary_analysis == true, status == complete, the cell’s run set being inside the applicable boundary, and the cell not being marked by an operator invalidation.
source: 5. Run Sets/run_index.csv and B0-scope-filter-finding.md section 7
The records are cited only after all four conditions are stated.
1.6.5 Endpoint definitions of the documentation experiment
An endpoint is a measured outcome used for a registered comparison. The reliability endpoint is success within budget. The cost endpoint is tokens to success, conditional on success in both arms. The disposition is the recorded decision about whether a cell is included, excluded, or retained for description.
source: 6. Metrics/statistical_analysis_plan.md line 202
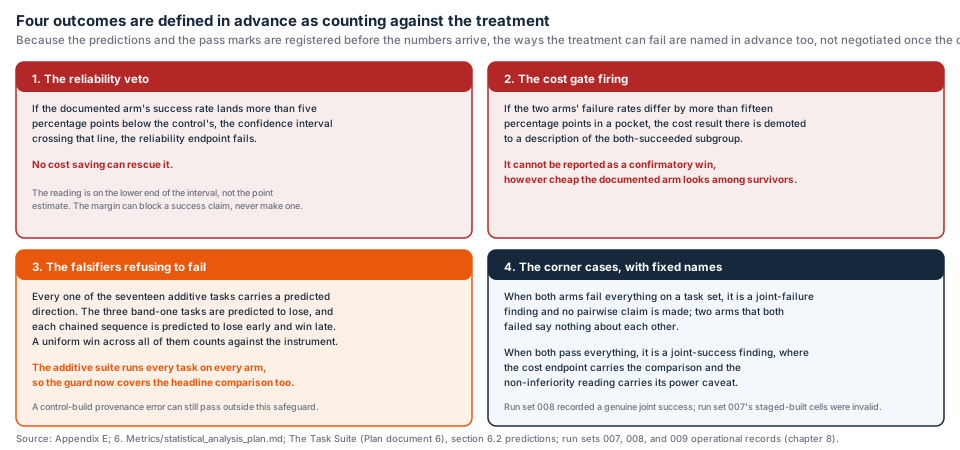
The failure conditions identify the pre-registered outcomes that count against the treatment.
1.6.6 Shakedown exit conditions of the documentation experiment
A shakedown can become data only when the instrument is stable, hidden checks pass, the cost ceiling is not breached, contamination checks pass, and the task substrate exists in both arms.
source: 5. Experiment/0. Plan/claim_registry.json
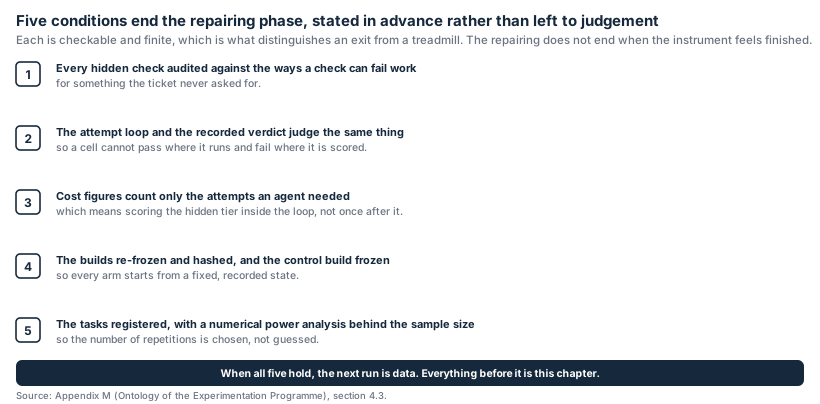
The exit conditions gate a shakedown before it becomes data.
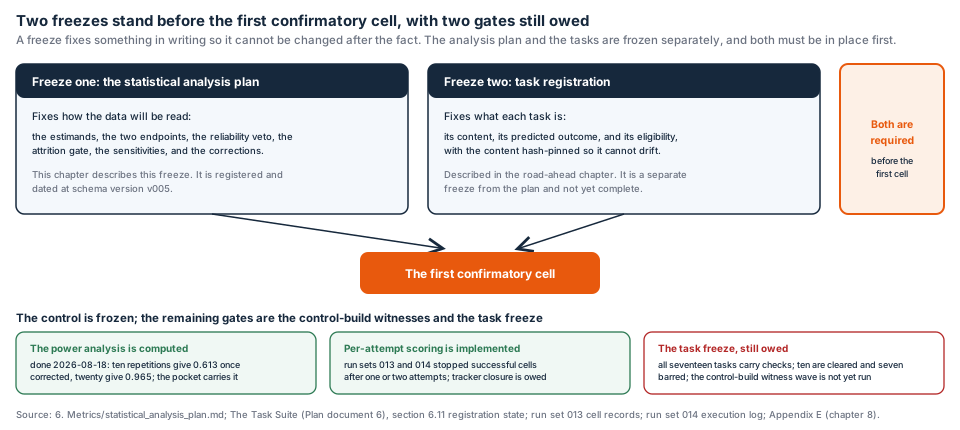
The two freezes preserve the registered plan and control before confirmatory analysis.
1.6.7 Registered analysis rules of the documentation experiment
The registered rules cover the estimands, comparisons, endpoints, repetitions, corrections, boundaries, inclusion conditions, and failure conditions. The pre-registered outcomes that count against the treatment remain part of the decision record. The campaign boundaries and their pooling rules are described in The campaign boundaries and their pooling rules.
source: operations/site-ia/A6-page-briefs.md line 182