Chapter 1.7 follows chapter 1.6, The pre-registered analysis plan, and precedes chapter 1.8, Threats to validity, within part 1, the reading path.
A shakedown precedes a confirmatory run. A run set groups the batch. The agent runs in a container. Its disposition and boundary are recorded. The dose ladder has a rung for each level. A lane, an isolated endpoint process used by a batch, is one platform version under test. Batch labels, short names that identify a run set in the registry, identify a batch. A hint, information that guides an agent, guides the run. A census, a count of records in scope, records the measured records. A waiver, an exemption from a rule for a cell, permits a documented exception.
The arm codes used in the batches are H-LAP-L5P, the documented reference; H-STR, the stripped twin; and H-NON, the unguided control. Literate and Anchored Programming (LAP) names the documented treatment. The codes identify codebase treatments, not the coding model; the run index records the model separately for each batch. Automatic mode is the execution mode added to section 4 after the architecture memo was last revised. Every batch described here is excluded from the confirmatory analysis. Its disposition may be complete or clean while its campaign role remains exploratory.
source: operations/site-ia/A6-page-briefs.md, section R6 owning files and terms
Figure D-R6-1. The run sets of the campaign by date, model, and boundary
%% figure D-R6-1
flowchart TB
  subgraph runsets["Run sets"]
    n1_1["5. Run Sets/run_index.csv"] --> n1_2["run_id"]
    n1_2 --> n1_3["date"]
    n1_3 --> n1_4["status"]
  end
  subgraph status["Status"]
    n2_1["model_class"] --> n2_2["valid_for_primary_analysis"]
    n2_2 --> n2_3["complete"]
    n2_3 --> n2_4["ended_disposition_unrecorded"]
  end
  subgraph stopped["Stopped before completion"]
    n3_1["stopped_before_completion"] --> n3_2["aborted_api_errors"]
    n3_2 --> n3_3["step"]
    n3_3 --> n3_4["step"]
  end
  subgraph completed["Completed"]
    n4_1["step"] --> n4_2["step"]
    n4_2 --> n4_3["aborted_wiring_gap"]
    n4_3 --> n4_4["step"]
  end
  subgraph tags["Tags"]
    n5_1["tags"] --> n5_2["display"]
    n5_2 --> n5_3["run_sets"]
  end
  n1_4 --> n2_1
  n2_4 --> n3_1
  n3_4 --> n4_1
  n4_4 --> n5_1
  n3_3 -- "completed_shakedown" --> n3_3_reference["reference"]
  n3_4 -- "completed_pilot" --> n3_4_reference["reference"]
  n4_1 -- "completed_smoke" --> n4_1_reference["reference"]
  n4_2 -- "completed_invalid" --> n4_2_reference["reference"]
  n4_4 -- "5. Run Sets/run_tags.json" --> n4_4_reference["reference"]
source: operations/site-ia/A3-diagram-specification.md
source: operations/site-ia/A6-page-briefs.md, section R6 diagrams
D-R6-1. Registry timeline shared with the batch ledger.
source: operations/site-ia/A6-page-briefs.md, section R6 diagrams
The registry contains 207 run-set rows. Its largest identifier is 244; the identifiers are creation labels rather than a row count.
source: 5. Experiment/5. Run Sets/run_index.csv (207 data rows; last row 244-20260914-thor-return-igx_thor)
The tag file groups the-2026-08-survey as run sets 043 to 054 and a8-a9-first-contact as run sets 057 and 058.
source: 5. Run Sets/run_tags.json key tags
The live summary supplies the current census of completed, valid, and invalid cells.
source: 7. Monitoring/LIVE_SUMMARY.md line 5
1.7.1 Exploratory disposition of the documentation experiment
The batches are shakedowns because they test the instrument, its guards, and its records before the confirmatory comparison. A clean record does not make an exploratory batch confirmatory. The registry status and the valid-for-primary-analysis field describe record condition. The campaign disposition describes eligibility for the registered analysis. The earlier pooled comparison is withdrawn because the paid-route cells used in it were invalidated under the protocol amendment. The dose curve is withdrawn because its exploratory dose ladder cannot support a confirmatory dose claim. Neither withdrawn result is replaced here.
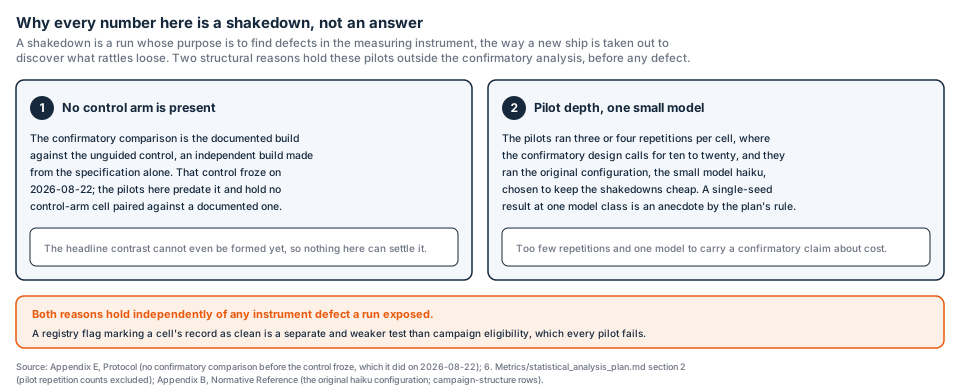
D-R6-12. Exploratory disposition and the separation of record condition from campaign eligibility.
source: operations/site-ia/A6-page-briefs.md, section R6 diagrams
1.7.2 Smoke-test record of the documentation experiment
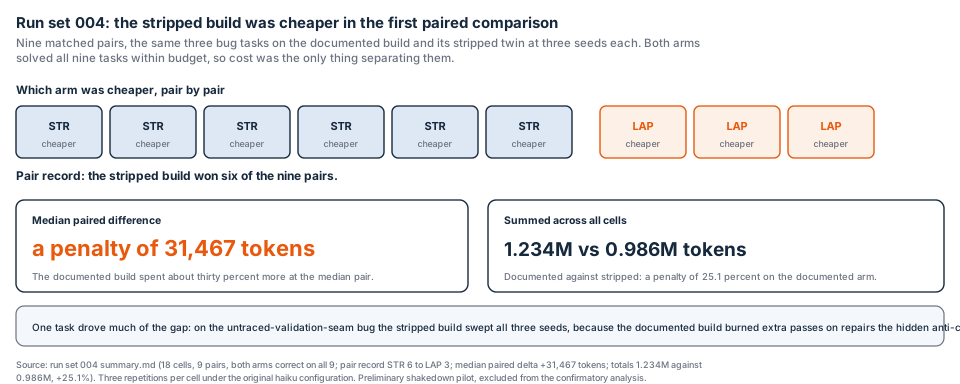
The smoke-test cells established whether the measurement engine could launch and whether the earliest paired records could be interpreted. The aborted launch exposed a harness wiring gap. The early paired record reports six of nine matched pairs for run set 004 and thirty of thirty-six with run set 005. Those observations are excluded from the confirmatory analysis because the batches were exploratory and the early design did not provide an eligible paired control population.
source: results_analysis.md of run sets 004-20260726-pilot-bugs-l5p-str and 005-20260727-dose-ladder-l1-l2t-l4p
source: operations/site-ia/A6-page-briefs.md, section R6 diagrams
D-R6-7. Early paired observations, with the model class and repetition count taken from the plotted rows.
source: operations/site-ia/A6-page-briefs.md, section R6 diagrams
source: operations/site-ia/A6-page-briefs.md, section R6 diagrams
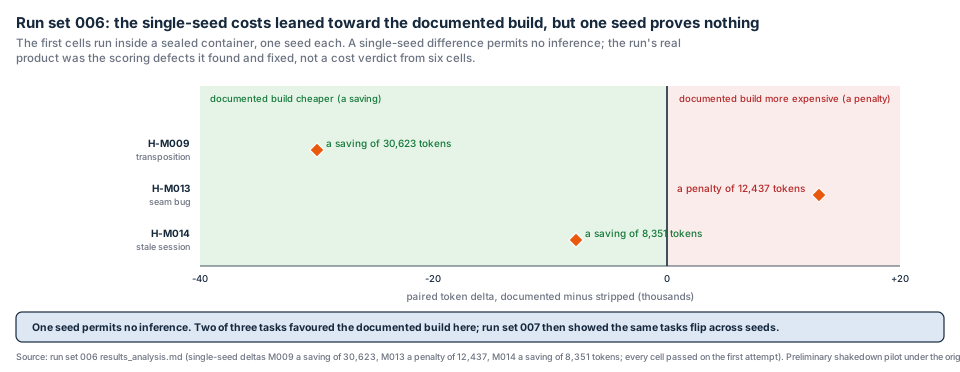
D-R6-8. Single-seed exploratory observations, with plotted model class and repetition count read from the rows.
source: operations/site-ia/A6-page-briefs.md, section R6 diagrams
1.7.3 Sealed-container record of the documentation experiment
The first sealed-container cells tested whether the agent could run without repository access or answer-key access. The container supplied isolation for those two risks. The missing authentication in a later launch stopped the batch and exposed a deployment dependency. The repaired instrument was then checked in later validation records, which remain exploratory because the repair sequence was still being tested.
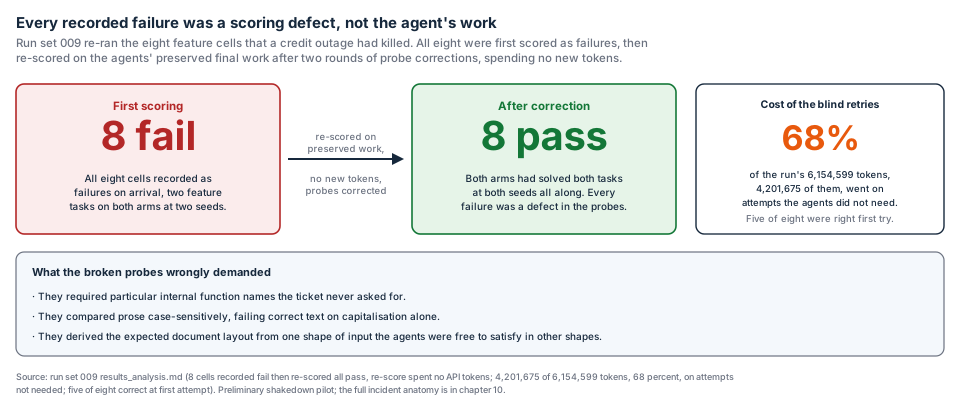
D-R6-9. Staging and rescoring records, parameterised from the plotted rows.
source: operations/site-ia/A6-page-briefs.md, section R6 diagrams
1.7.4 Documentation-use record of the documentation experiment
The power shakedown tested run-to-run variation and documentation use. Its purpose was to reveal whether the instrument measured agent work or merely measured access to a finished feature. A staging error left some feature cells with the feature already present, so their checks scored the reference implementation rather than new work. The admission guard was added to reject such cells before launch, and the affected observations were excluded from the confirmatory analysis.
The documentation-read signal is derived from per-task lap_read tokens against the L5P payload of 43,683 tokens. A typical cell read two percent, with a range of 1.8 to 9.2 percent and one outlier at 44.3 percent. These percentages are derived from the token figures on the cited results line, which records the lap_read tokens rather than the percentages.
source: 5. Experiment/5. Run Sets/007-20260806-instrument-power-shakedown/results_analysis.md line 38; percentage = lap_read tokens / 43,683 L5P payload tokens
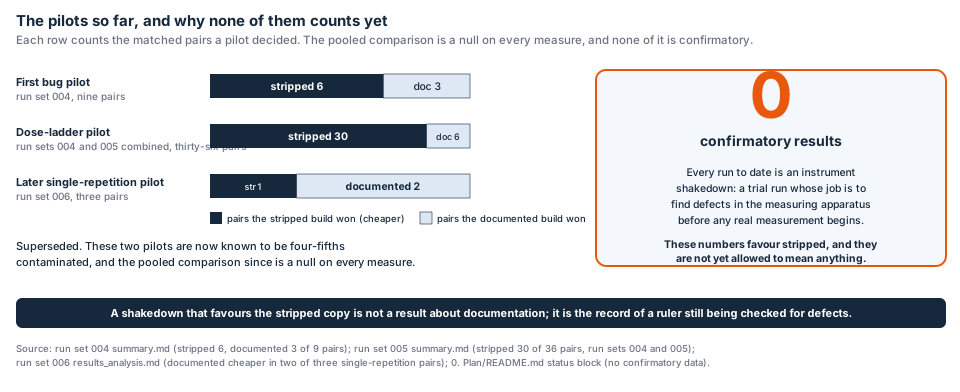
D-R6-10. Starting pilots and later exploratory records, parameterised from the plotted rows.
source: operations/site-ia/A6-page-briefs.md, section R6 diagrams
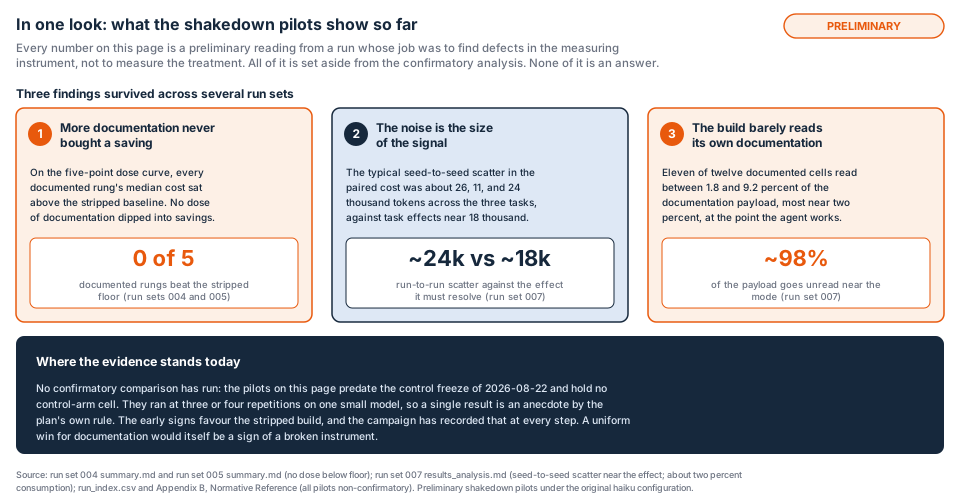
D-R6-11. Exploratory records in one view, with model class and repetition count taken from the plotted rows.
source: operations/site-ia/A6-page-briefs.md, section R6 diagrams
Figure chart-1. A record chart of the five retained chart series, with each caption tied to the model class and repetition count in its plotted rows.
%% figure chart-1
flowchart LR
  subgraph g1[" "]
    n1["A record chart of the five retained chart series<br/>each caption tied to the model class and repetition count in its plotted rows"]
  end
source: operations/site-ia/A3-diagram-specification.md
source: operations/site-ia/A6-page-briefs.md, section R6 diagrams
D-R6-2. Record chart with model class and repetition count read from the plotted rows.
source: operations/site-ia/A6-page-briefs.md, section R6 diagrams
Figure chart-2. A record chart of the five retained chart series, showing the plotted rows without a pooled confirmatory estimate.
%% figure chart-2
flowchart LR
  subgraph g1[" "]
    n1["A record chart of the five retained chart series<br/>the plotted rows without a pooled confirmatory estimate"]
  end
source: operations/site-ia/A3-diagram-specification.md
source: operations/site-ia/A6-page-briefs.md, section R6 diagrams
D-R6-3. Record chart with model class and repetition count read from the plotted rows.
source: operations/site-ia/A6-page-briefs.md, section R6 diagrams
Figure chart-3. A record chart of exploratory variation across the plotted rows, separated by model class and repetition count.
%% figure chart-3
flowchart LR
  subgraph g1[" "]
    n1["A record chart of exploratory variation across the plotted rows<br/>separated by model class and repetition count"]
  end
source: operations/site-ia/A3-diagram-specification.md
source: operations/site-ia/A6-page-briefs.md, section R6 diagrams
D-R6-4. Record chart with model class and repetition count read from the plotted rows.
source: operations/site-ia/A6-page-briefs.md, section R6 diagrams
Figure chart-4. A record chart of exploratory outcomes, retaining the row-level model class and repetition count.
%% figure chart-4
flowchart LR
  subgraph g1[" "]
    n1["A record chart of exploratory outcomes<br/>retaining the row-level model class and repetition count"]
  end
source: operations/site-ia/A3-diagram-specification.md
source: operations/site-ia/A6-page-briefs.md, section R6 diagrams
D-R6-5. Record chart with model class and repetition count read from the plotted rows.
source: operations/site-ia/A6-page-briefs.md, section R6 diagrams
Figure chart-5. A record chart of exploratory costs, with repetition count and model class taken from the rows plotted.
%% figure chart-5
flowchart LR
  subgraph g1[" "]
    n1["A record chart of exploratory costs<br/>repetition count and model class taken from the rows plotted"]
  end
source: operations/site-ia/A3-diagram-specification.md
source: operations/site-ia/A6-page-briefs.md, section R6 diagrams
D-R6-6. Record chart with model class and repetition count read from the plotted rows.
source: operations/site-ia/A6-page-briefs.md, section R6 diagrams
1.7.5 Complete-suite record of the documentation experiment
The complete-suite sweep tested whether the repaired sequence could traverse the intended task set. Credit exhaustion stopped the first sweep before all cells were reached. The remaining-task batch supplied the unvisited work and recorded passes, failures, and an invalid disposition. The outcome table is retained as an audit record and excluded from the confirmatory analysis because these batches were still testing the instrument and its operating limits.
source: results_analysis.md of run set 017-20260818-remaining-task-sweep, audit section 4.10
1.7.6 Outside-result verification of the documentation experiment
The measuring device once allowed a cell to write the container path into the product. The path check existed to keep the execution environment outside the measured product. The faulty cell passed internal tests while failing external checks, which showed that the instrument could stop on the wrong evidence. The repair added an outside-result confirmation before cell completion, and the affected run was excluded from the confirmatory analysis.
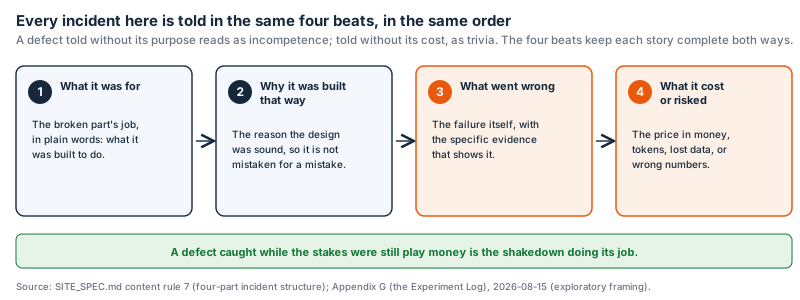
D-R6-13. Four-part incident record for the instrument failures.
source: operations/site-ia/A6-page-briefs.md, section R6 diagrams
1.7.7 Withdrawal of pooled readings
The earlier pooled completion and token-cost comparison is withdrawn. The cells were assembled from exploratory and later invalidated routes, so the pooled estimate does not represent the registered confirmatory population. The earlier dose curve is also withdrawn because its ladder records exploratory dose behavior rather than a registered dose effect. The withdrawal preserves the underlying batch records and removes the unsupported estimates.
1.7.8 Automatic-mode record of the documentation experiment
Automatic mode is the later execution mode recorded outside the architecture memo’s mapped sections. Its range is recorded in the batch ledger. The batch ledger preserves the run-set range 075 to 206, while the live summary supplies the current cell census. The automatic records are excluded from the confirmatory analysis because their execution mode and review boundary differ from the registered comparison.
source: 5. Run Sets/run_tags.json key tags; 7. Monitoring/LIVE_SUMMARY.md line 5; X3, The batch ledger
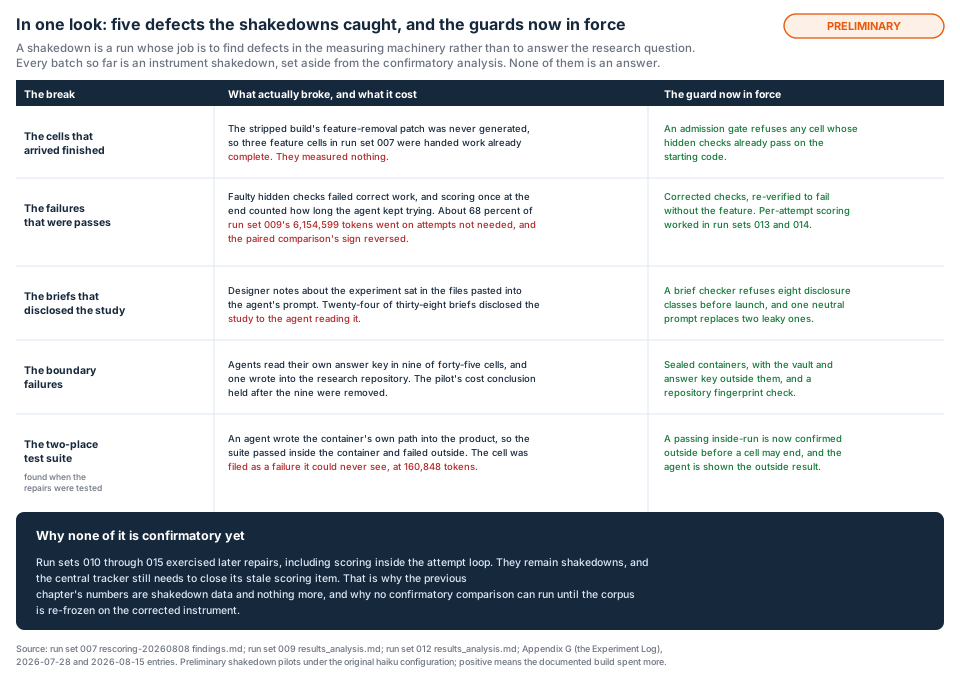
D-R6-14. Instrument boundaries and the automatic-mode record.
source: operations/site-ia/A6-page-briefs.md, section R6 diagrams
1.7.9 Instrument-failure lessons of the documentation experiment
The feature-staging incident concerned a guard intended to ensure that an agent received an unfinished feature. It was built to make the starting state testable. The evidence showed a staged feature already present, so the checks measured the reference implementation. The cost was loss of agent-work evidence and the addition of an admission guard.
source: operations/site-ia/A6-page-briefs.md, section R6 owning files
The hidden-check incident concerned guards intended to verify the finished work. They were built to test the product after agent execution. The evidence showed correct agent work rejected by hidden checks. The risk was false failure, which required a harness repair before confirmatory use.
The closeout incident concerned the record chain intended to preserve a reproducible batch disposition. It was built to connect execution, scoring, and review. The evidence showed a break in that chain during closeout. The risk was an unreviewable batch record, so the closeout procedure was revised.
The answer-key incident concerned a boundary intended to keep the answer key, the reference used to judge agent work, away from the agent. It was built to prevent information leakage. The evidence showed that the key could be read through an instrument path. The risk was contaminated agent behavior, so the isolation route was repaired.
The container-path incident concerned the boundary intended to keep environment paths out of the product. It was built to distinguish product output from harness state. The evidence showed the container path written into the product. The risk was a false product result, so outside-result verification was added.
The hidden-scoring incident concerned scoring intended to observe the product without changing the task sequence. It was built to keep evaluation separate from agent work. The evidence showed hidden scoring attached to the wrong execution point. The risk was a misleading pass or failure, so the scoring sequence was repaired.
The credit-exhaustion incident concerned resource limits intended to stop an unaffordable batch safely. It was built to preserve a usable partial record when credit ended. The evidence showed a sweep stopped before its planned work. The risk was an incomplete census, so remaining work received a separate disposition.
The shell-less incident concerned the shell boundary intended to provide the execution interface used by the harness. It was built to make command execution available to a cell. The evidence showed cells running without a shell, with roughly 134 cells invalidated by the ruling. The risk was that their records could not support the intended execution claim, so they remain outside the confirmatory analysis.
source: Appendix I, Operator Decision Sheet.md line 525
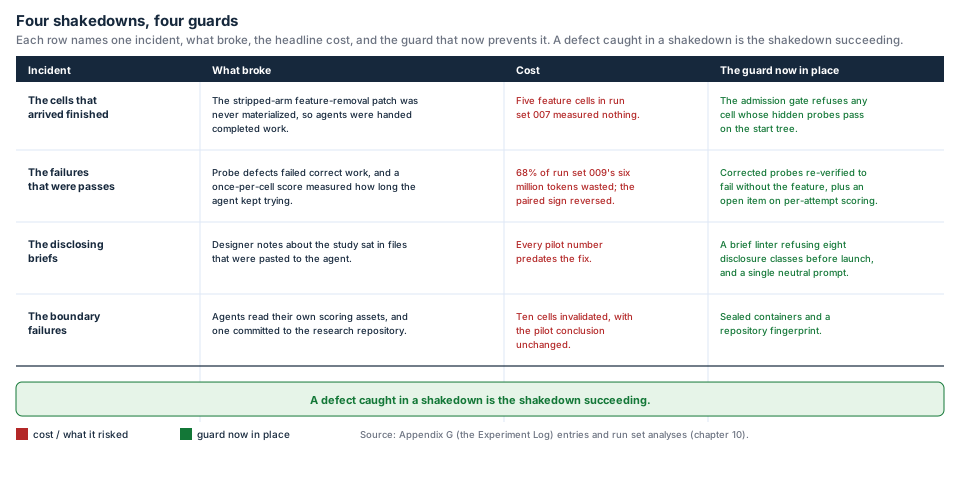
D-R6-15. Incident scoreboard with purpose, failure evidence, and consequence.
source: operations/site-ia/A6-page-briefs.md, section R6 diagrams
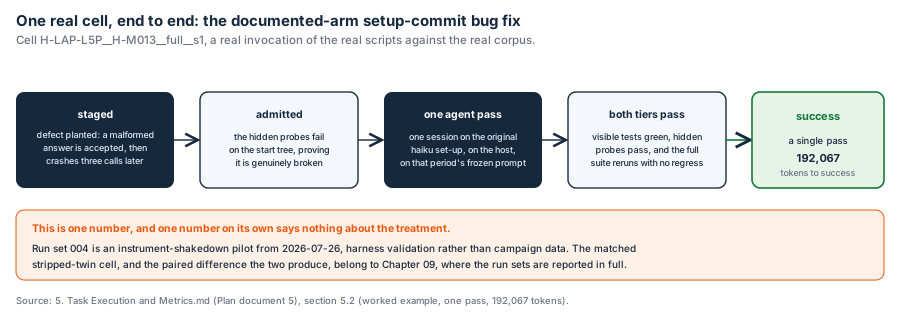
D-R6-16. Cell record chain from staging to disposition.
source: operations/site-ia/A6-page-briefs.md, section R6 diagrams
1.7.10 Artifact-activation record of the documentation experiment
A registered diagnostic pilot ran in September 2026 as run sets 348 to 353 under the cohort tag artifact-activation-pilot-v2. It measured seventy-two cells: three arms, two instruction settings, four tasks, and three seeds. The instruction setting varied whether the agent received a short procedure, frozen before the runs, telling it how to look for and verify repository documentation. Fifty-six of the seventy-two cells passed their hidden checks.
source: 5. Experiment/8. Reports/Artifact Activation/artifact-activation-v2-deterministic-analysis.md
Two questions the pilot was built to answer are now answered. Every reference inside the documentation resolves to a file that exists, across 593 indexed code and test paths, 28 seam endpoints, 21 inline trace anchors, and 44 task relevance paths. That establishes that no reference is broken. It does not establish that the prose is accurate, which is a reading task and remains open. In twenty-two of the twenty-four documented-arm cells the agent read a document its own task’s relevance map names and then read a code file that map names, both before its first edit. The explanation that the documentation went unread is therefore closed on the measure the protocol asked for.
source: 5. Experiment/8. Reports/Artifact Activation/artifact-integrity-check.txt; artifact-activation-v2-event-chain.md
The pilot’s own comparison between arms is withdrawn. Read as forty-eight matched cells it showed the documented arm behind its stripped twin by 20.8 percentage points. Recomputed with the task as the unit of analysis, across every task the campaign has run against all three arms on one served model, the documented arm sits 2.4 points ahead of its twin, and no comparison between arms is resolved. Choosing those four tasks rather than all nine accounts for 8.1 points of the difference between those two readings. Sampling within those same four tasks accounts for a further 15.1 points.
source: 5. Experiment/8. Reports/Artifact Activation/campaign-task-level.md
1.7.11 Measured limits of a pilot of this size
Splitting the variation in cell pass rates into its sources, across 323 attempts on nine tasks and three arms, with each cell’s own sampling term subtracted so that small-sample spread is not reported as a real effect: the task contributes 32.5 points of spread and 85.2 percent of all variation, the arm contributes a quantity the method cannot separate from zero, the task and arm interacting contribute 7.1 points, and sampling noise inside a cell contributes 11.6 points.
source: 5. Experiment/8. Reports/Artifact Activation/variance-components.md
An interval on the difference between arms, from a resampling procedure that varies both which tasks were set and which attempts were made, runs from 11.2 points against the documented arm to 16.5 points in its favour. A margin of ten points was declared in the analysis program before the estimate was read, as the smallest average difference that would change a decision about maintaining the documentation. The interval is wider than that margin, so the comparison is unresolved rather than equivalent. No difference is detectable at this resolution, which is a weaker statement than no difference exists.
source: 5. Experiment/8. Reports/Artifact Activation/variance-components.md; margin declared in 1. Harness/scripts/analyze_variance_components.py
The same components give the size a future study would need. The interaction between task and arm is a real difference that varies from task to task, so running more attempts at the same tasks cannot shrink it and only more tasks can. At three attempts per cell, resolving a ten-point difference needs fifty-nine tasks. At twelve attempts per cell it needs eighteen. The registered pilot used four tasks at three attempts, so adding seeds to a small number of tasks is close to the least effective available use of the measurement budget.
source: 5. Experiment/8. Reports/Artifact Activation/variance-components.md, design table
1.7.12 Flat response across the documentation dose ladder
The eight documentation profiles were compared against each other for the first time, after removing the effect of which task each profile happened to be given. The comparison covers 610 cells across eleven tasks on one served model. The profiles carry from 2,390 bytes of documentation artifact at the lightest rung to 69,752 bytes at the fullest, a twenty-nine-fold range. Their deviations from the task average scatter between 11.3 points below and 11.4 points above, with no rising or falling trend, and the correlation between artifact size and advantage across the eight profiles is 0.25 on eight points.
source: 5. Experiment/8. Reports/Artifact Activation/campaign-task-level.md, dose table
This is an exploratory reading and is not a dose result. The profiles differ in the structure of their documentation as well as in its volume, so a flat response across this particular ladder does not establish that documentation content is inert.
source: operations/site-ia/A6-page-briefs.md line 188
1.7.13 Pivot to brownfield seeded defects and the first imported project
The three readings above, taken together, changed the design. The ticket a cell was given explained 85.2 percent of the variation in success and the build it ran on a quantity indistinguishable from zero; the feature-addition tickets never exercised the failure the documentation exists to prevent, which is a change on one side of a module boundary breaking the other side; and a pilot of the registered size could not resolve a ten-point difference. Amendment A15, ratified on 2026-09-20, therefore closed the phase in which agents added features to the purpose-built Evidenceline product. In the second phase an agent is handed an imported open-source project into which one defect has been deliberately seeded on a boundary the documentation names, and a ticket written at one of three levels of specificity: the symptom alone in a user’s words, the symptom with the subsystem named, or the symptom with the file and function named. The same defect and the same ticket are given on three arms of identical executable code: the untouched project, a matched-information arm carrying orientation files and inline markers but no relationship map, and a full arm that adds the map. The claim under test is that the full arm repairs the symptom-only ticket more often than the matched arm, and that the advantage shrinks to nothing as the ticket names the location itself.
source: 5. Experiment/0. Plan/Appendix Q (Project H Retrospective and the Pivot to Brownfield Defects); 5. Experiment/0. Plan/Appendix C (Hypotheses and Estimands) Table C, rows B-MECH and B-SPAN
The first imported project is changedetection.io, a self-hosted web application that watches web pages and notifies its owner when they change, pinned at one upstream commit and held as Project J. It has 38,697 source lines in 153 files and 36,697 test lines in 167 files. Its two documented arms were produced by a deterministic program from a reviewed map of thirteen boundaries, and the three arms were proved identical in executable code across 320 Python files once comments and docstrings are removed. Three defects were seeded. J-M001 renames one dictionary key in the API’s timezone validator, so a mistyped zone name is accepted and the watch is silently never checked again. J-M002 makes one notification token stop honouring a watch’s Link to Open, so RSS entries link to the raw watched address. J-M003 stores a worker identifier as a string where the release compares it with a number, so every watch stays marked as running after its first check.
source: 5. Experiment/2. Project Library/Project J - changedetection.io/source_manifest.json; HASP Analysis/equivalence_check.md in the same folder; 5. Experiment/4. Task Library/Project J/J-M00{1,2,3}/defect.spec.md
Each defect had to pass a baseline check before any agent saw it: the project’s own visible tests, the five test files an agent is told to run, must stay green on the defective tree, and the withheld upstream tests together with a probe written from the ticket must fail on it and pass on the clean tree. J-M001 and J-M002 passed on all three arms, the visible command completing in 143 to 148 seconds with 35 tests green each time. J-M003 failed the check. Its defect leaves every watch marked as running, so any visible test that waits for a recheck hangs until its per-test timeout; the first, test_setup_group_tag, timed out at 120 seconds, and the five-file command did not finish within 1,500 seconds. An agent running its own tests would see the hang, so the task cannot measure whether documentation finds the cause. It was set aside and recorded, and a replacement defect is owed. This is an instrument finding of the same kind as those in section 1.7.9: the blindness of the visible tests is a property that has to be measured for every seeded defect, not assumed from the diff.
source: 5. Experiment/4. Task Library/Project J/J-M003/baseline_failure_check.md; J-M001/baseline_failure_check.md; J-M002/baseline_failure_check.md
Before the arms are compared, each admitted defect is attempted five times at the symptom-only ticket and five times at the fully located ticket on the untouched arm alone. A defect is admitted to the comparison when the symptom-only ticket succeeds one to three times of five and the located ticket at least four of five; one that is solved from the symptom alone four or five times leaves the documentation nothing to add, and one that fails the located ticket twice is not repairable within the budget for reasons the ticket does not control. That calibration batch, run set 354, twenty cells on the DGX serving machine, started on 2026-09-20. Its cells are marked invalid for primary analysis by construction, because they exist to choose the tasks, and it has no results yet. The second serving machine, the IGX Thor, could not be reached when the batch was launched.
source: 5. Experiment/0. Plan/5. Task Execution and Metrics.md section 5.11.3; 5. Experiment/5. Run Sets/draft-specs/batch-brownfield-J-calibration-NON.json